
Problem
Every project had its own server setup, its own deployment script and its own logging conventions. Each release briefly took the site down, and when an error came up, tracking down which server and which request it came from took hours.
Platform is the common ground under Jekirdek Teknoloji’s products. Every product starts from the same project template, is built and deployed by the same central workflows, and sends metrics, logs and traces to the same monitoring server. Connecting a project to the infrastructure takes nothing more than a two-line workflow file.
Every project had its own server setup, its own deployment script and its own logging conventions. Each release briefly took the site down, and when an error came up, tracking down which server and which request it came from took hours.
Hardened server types provisioned with a single command; centralized CI/CD that every project calls the same way; blue-green deployment where a new version takes no traffic until it passes its health check. A single agent on each server collects metrics, logs and traces and ships them to the central server; alerts are grouped and routed to Slack by severity.
An alert arrives: the problem, the server and the first thing to do, all in one message.
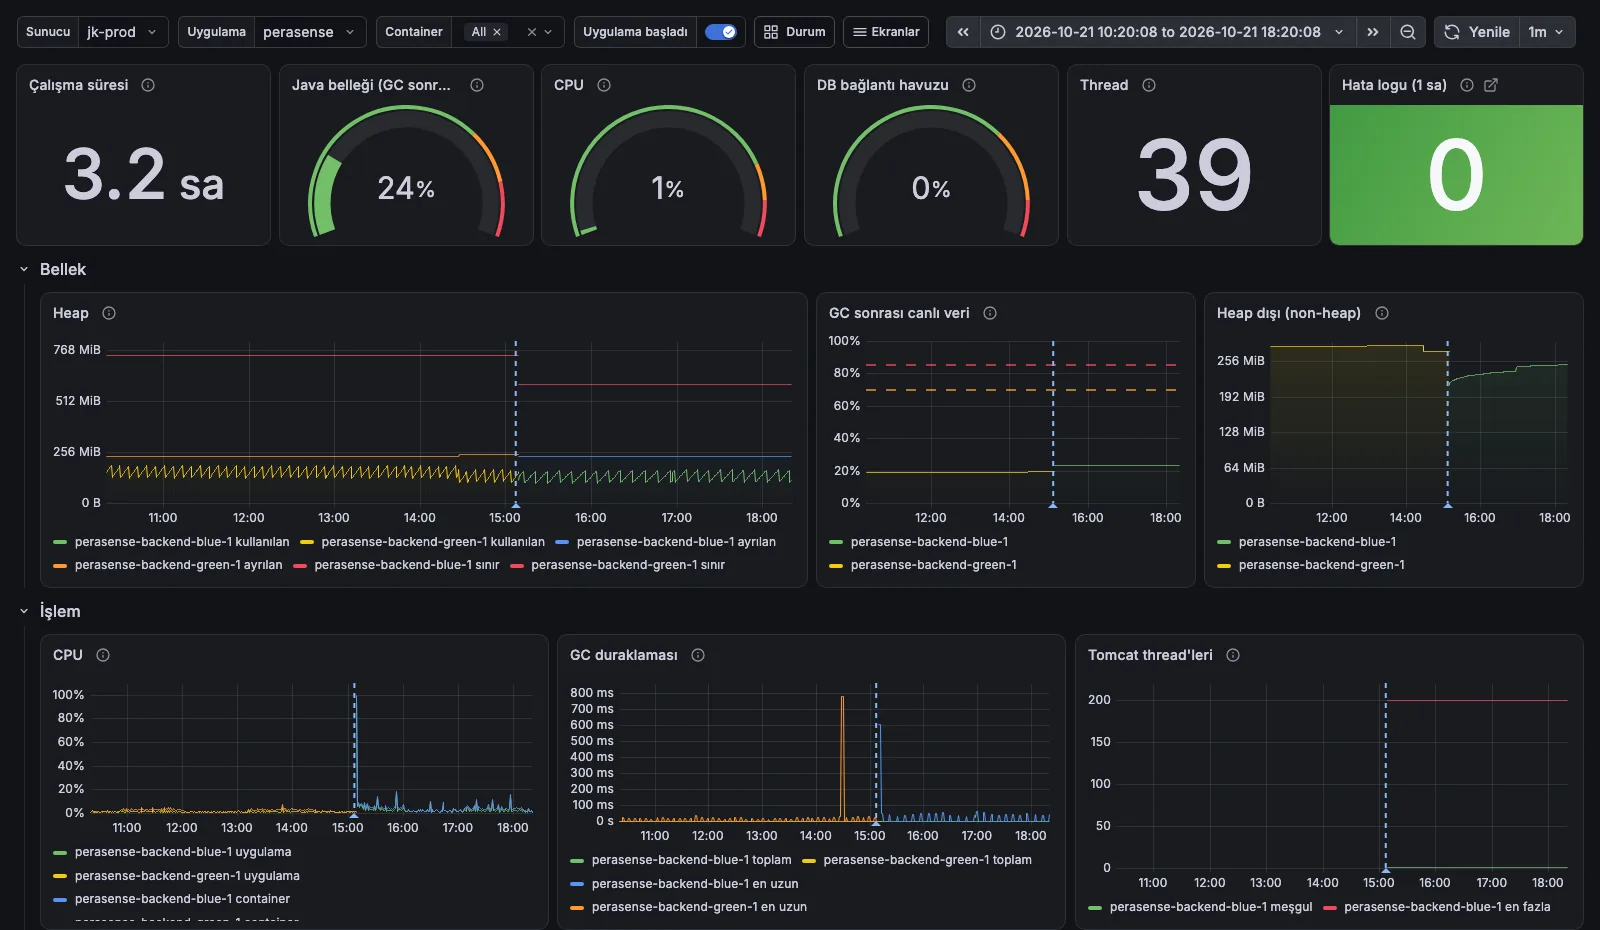
Which app, which server, since when; error rate and response time.
Error lines are filtered by level, project, service and environment.
Shows the step where the request got stuck, with timings layer by layer.
The fix ships through the same pipeline, or the previous version is restored without a rebuild.
A resolution message lands in Slack, with how long the problem lasted filled in automatically.
Pre-releases go to the test environment automatically; promoting to production takes a deliberate approval. Images are stored by version, so rolling back needs no rebuild.
The new version starts up alongside the old one. If it passes the health check, traffic switches to it; if not, it’s removed and the old version keeps serving.
A Grafana Alloy agent on every server collects metrics, logs and traces and sends them, encrypted and labeled by server, environment and project, to the monitoring server.
Requests are recorded with OpenTelemetry. From the trace ID in a log line you jump to the request’s entire journey, and from there to the metrics at that same moment.
Prometheus and Loki rules are grouped in Alertmanager; side effects are suppressed while the root cause is firing, and critical alerts and warnings go to separate channels.
Application and monitoring servers are set up with a single re-runnable script, including key-based SSH, fail2ban, a firewall, automatic updates and encrypted backups.
Grafana dashboards and diagrams of the infrastructure. Domain names, server names and database names on the status screen are hidden.
A new version comes up next to the old one as the second color; Traefik sends it no traffic until it passes the health check, and once it does, the old color shuts down. Rolling back is just a redeploy with the old tag, no build needed. The collector on each server sends logs, metrics and traces to a separate monitoring server.
External serviceServers, networking and certificates
 Ubuntu
 Docker
 Traefik
 Cloudflare
Central workflows and versioned images
 GitHub Actions
Metrics, logs, traces and alerts
 Grafana
 PrometheusLokiTempoAlloy
 OpenTelemetry
 Sentry
Shared databases and encrypted backups
 MySQL
 PostgreSQL
 AWS S3